In order to raise funding today, founders must demonstrate that their startup can scale quickly, at positive unit economics and thus a clear path to profitability.
What are Your Unit Economics?
There is only one acceptable way to answer this question no matter your stage (pre-seed, seed etc), business model (SaaS, marketplace) or industry. Within the context of fundraising either live pitching or during one-on-one questions, you have to provide a straightforward answer using relevant KPIs. Here are two answers to the question, can you spot the great answer and the terrible one?
Well, you know, we have a lot of users signing up and using our platform, and we’re definitely spending some money on ads and stuff to get them. I think they stay with us for a good while, and… yeah, we’re working on making sure everything balances out. We’re still figuring out the exact numbers and optimizing things.
OR
Our unit economics are positive and moving in the right direction. For each customer, we earn a Lifetime Value (LTV) of $238 while spending $182 on Customer Acquisition Cost (CAC), resulting in a 1.3x LTV:CAC ratio. We are taking initiatives to lower CAC and increase LTV to take us to an above average industry LTV:CAC of 5.0x over the next three years. Our Gross Margins stand at 65%, which means our CAC payback period is just under 5 months.
If you were an investor or a jury member, how would you rank these two founders everything else being equal? Obviously, the second founder demonstrates a good understanding of their business and tells a good story while the first just waffles. Founders embarking on the fundraising journey without being well-equipped to answer pivotal questions on their startup’s unit economics are, metaphorically, shooting themselves in the foot. Understanding and articulating unit economics alongside key metrics and KPIs is paramount in building investor confidence as well as building financially sustainable businesses.
Unit Economics for Early-Stage Startups: From Idea up to Seed Stage
At the earliest stages of a startup, unit economics conversations are, or at least should be simple. Investors want to know that founders understand the key drivers of the business and what assumptions need to hold true for a startup, and by extension its investors to succeed. Unit economics refer to the profitability of each unit before admin costs are considered. A unit refers to ONE customer or service or product (depending on the business model).
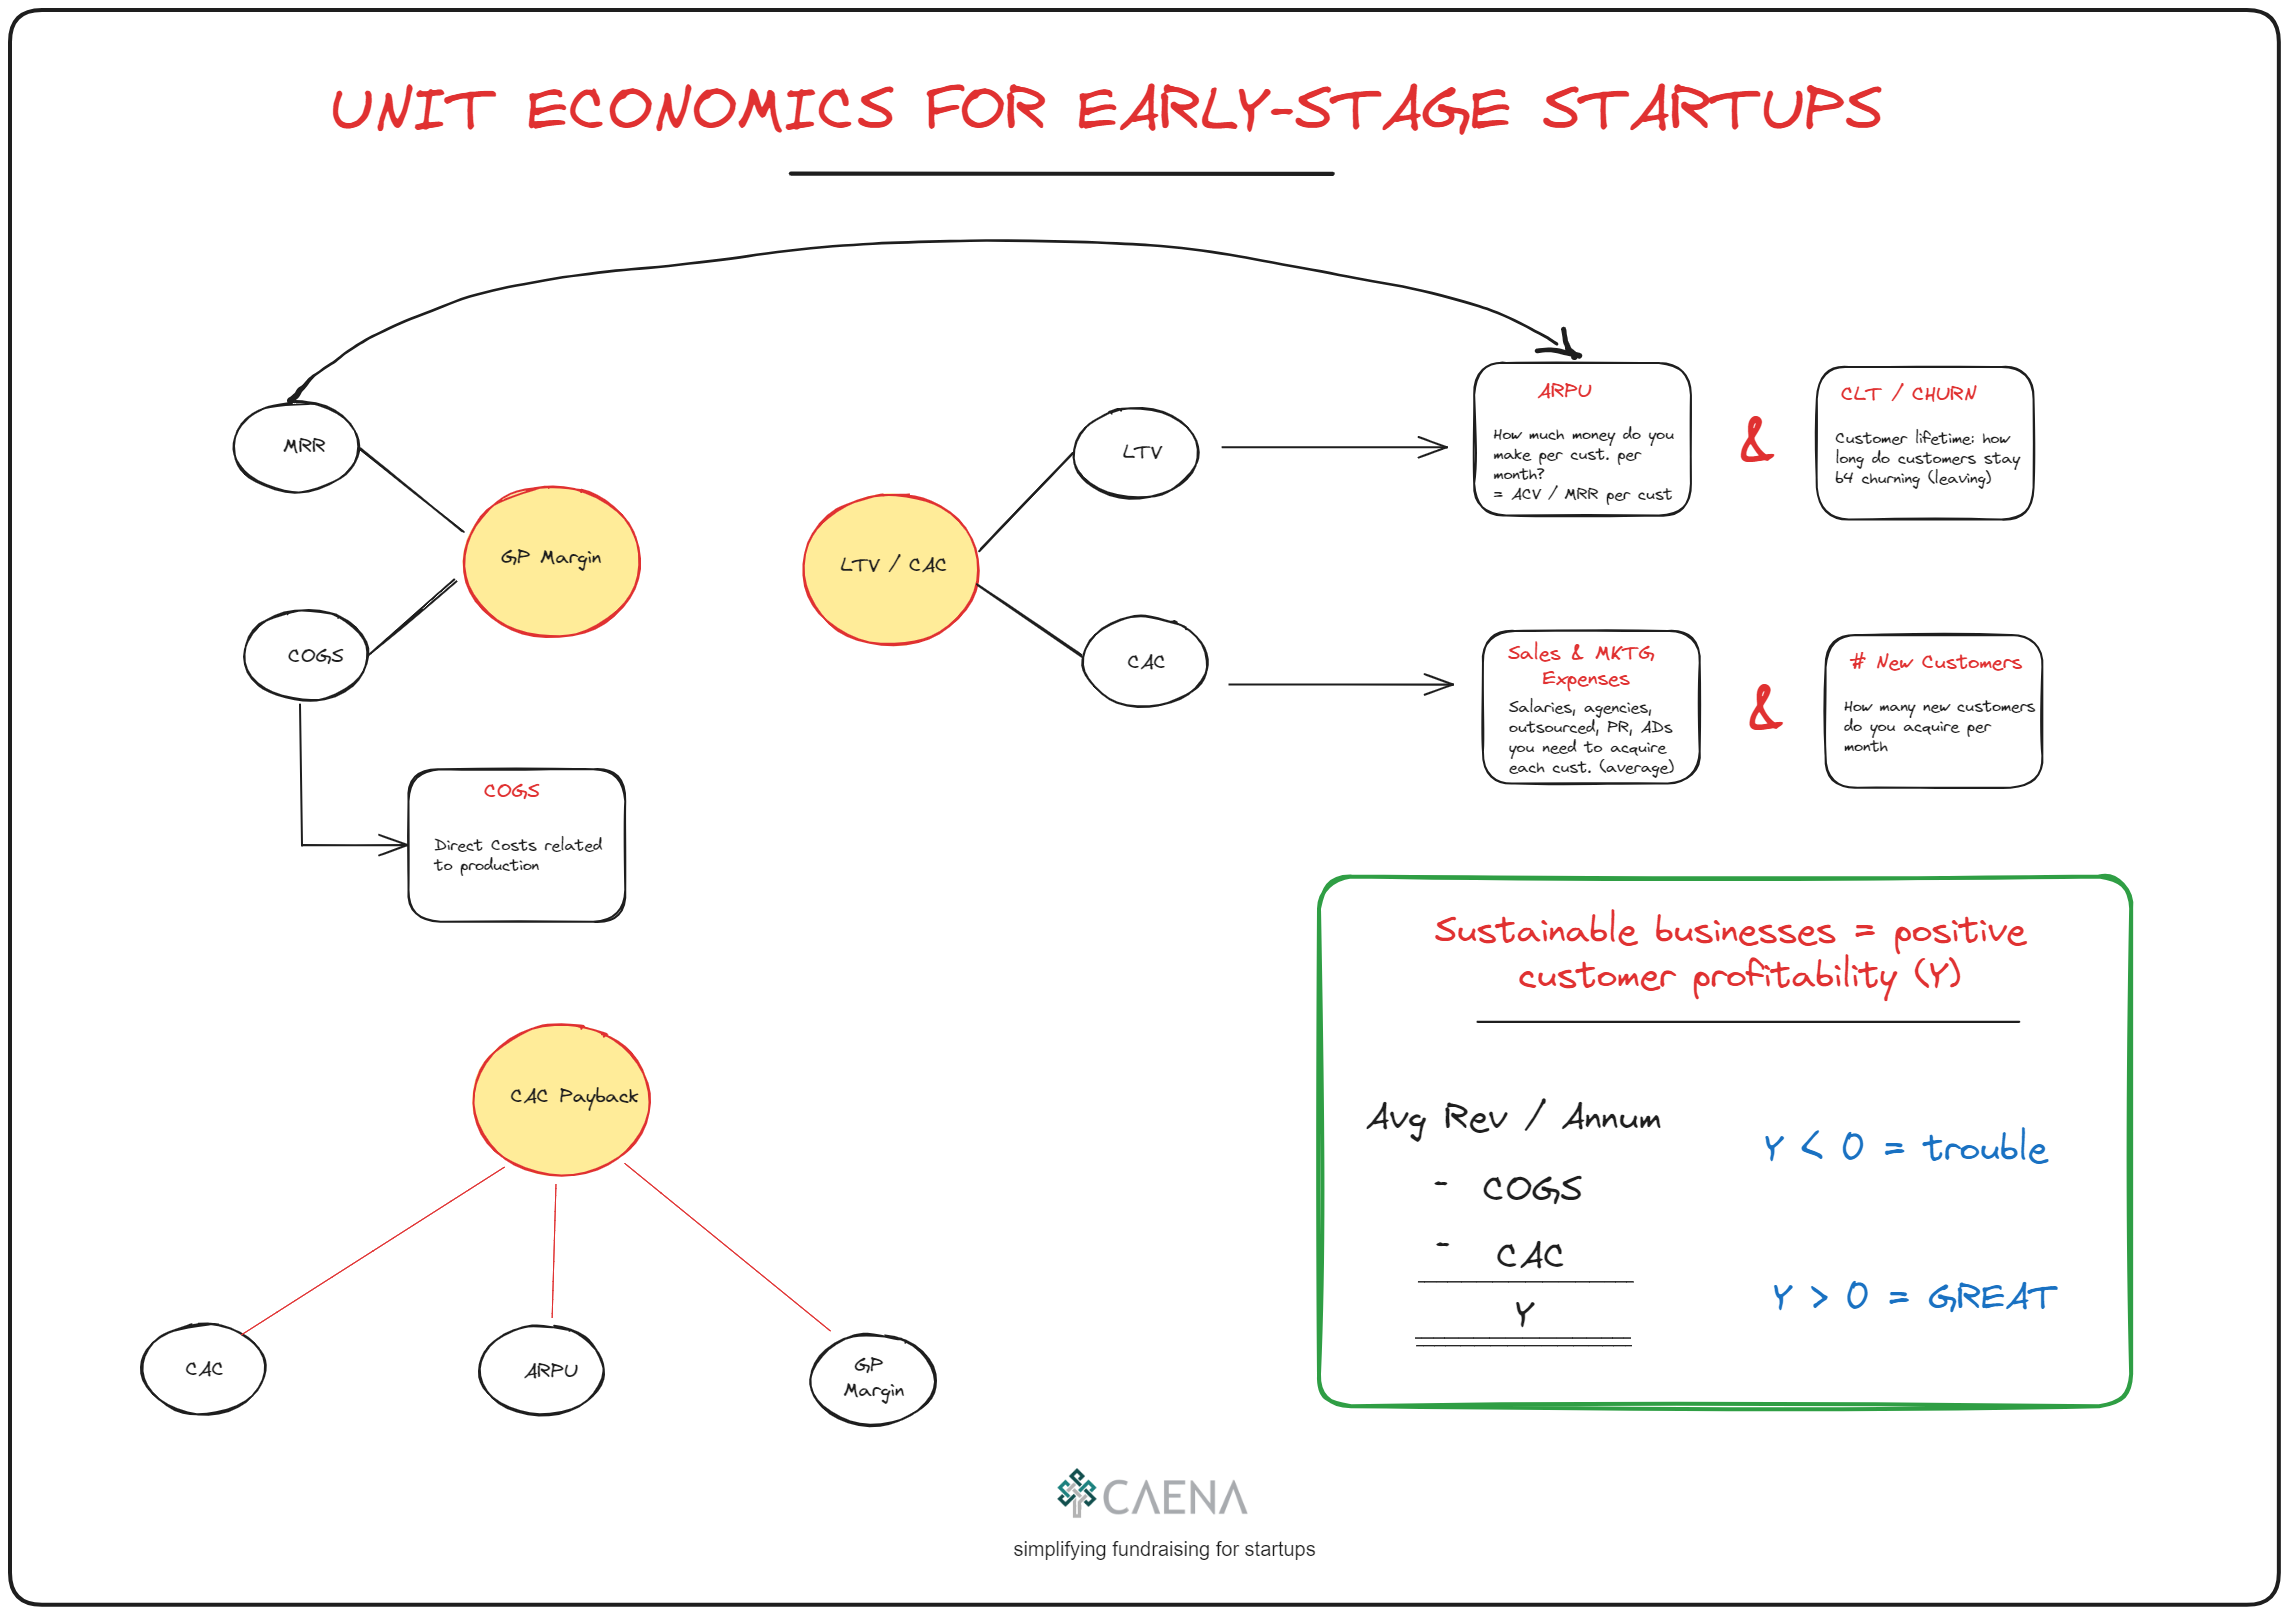
For early-stage founders, LTV/CAC is the most common KPI which helps answer that question “what are your unit economics?” The other, related KPI is CAC Payback Period. Both KPIs are a measure of a consumer company’s efficiency of marketing spend and thus its overall financial health. The metrics are particularly useful for subscription based business models but still relevant for others such as marketplaces and e-commerce.
From the great example above, we can see a founder use a combination of these two metrics in a short, succinct paragraph to convey the health of their business.
How to Calculate LTV/CAC
The LTV is the total value a business can expect from a single customer over the duration of their relationship with the company, on average. This seems simple enough, but unfortunately—like a lot of things in venture—the definition of ‘value’ varies very wildly from revenue to net profit. In its simplest form LTV is a function of just two things: average revenue per customer (or other unit) and average lifetime per customer. Other more complex calculations take into account average cost of service (ACS), contribution margin and even weighted average cost of capital (WACC). For simplicity and considering early stage startups, we err on the simplicity and strike a balance and consider Average Gross Profit Margins in the calculations.
To bring this to life, let’s work with some actual numbers starting with basic assumptions:
Average Revenue per Unit (ARPU): It seems simplistic but the first question every entrepreneur should be able to answer BEFORE starting out is “how much will you charge per customer.” Different business models have slight variations on this revenue metric:
- SaaS: Monthly recurring revenue (MRR) per customer, this is simply average monthly subscription fee. If there are are different pricing tiers, MRR is an average of all the different tiers.
- B2B enterprise: Average contract value (ACV) represents the average revenue generated from each customer contract in a given time frame, typically annually.
- Consumer: Average order value (AOV) indicates the average amount of money each customer spends per transaction with an e-commerce store or website.

Churn Rate: (or monthly unit churn) Refers to the rate at which customers stop using a product or service every month. Every business has some sort of churn or the other. Lower churn translates to a stickier product and a more successful business model as you get more revenue out of each CAC dollar. For startups, churn usually starts high as the product is not fully developed but should stabilise at or around industry average over time.

Monthly unit churn should not be confused with dollar churn, MRR churn and other revenue based churn calculations. Low churn is great while a high churn is alarming as this means the business will have to keep spending a lot of money to acquire new customers. Growth is going to be expensive, very expensive in this case. For consumer SaaS companies, a churn rate below 5% monthly is great and is typically achieved by large startups that have been in the market for many years. It is not uncommon for B2B companies to have almost zero churn as they have a low number of highly engaged customers they deal with personally.
Customer Lifetime Value (LTV): The LTV is the lifetime multiplied by ARPU and Gross Profit Margins.
Customer Lifetime: This is the average length of time (months) that a customer stays in a subscription before they leave (churn). It’s simply the inverse of churn.
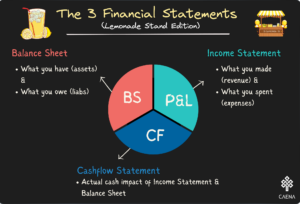
Gross Profit Margins: To calculate gross profit margin, you need to estimate your cost of goods sold (COGS) and then remove this from revenue.
COGS: This is the direct costs involved in producing goods or delivering services sold by a business. It includes material costs, direct labour, and other direct costs but excludes indirect expenses like distribution and sales force costs. For a retailer, it’s the cost of items purchased for resale. For a software company, COGS is the aggregate of hosting and customer satisfaction expenses. Essentially, COGS gives insight into the efficiency of the production process.
COGS = Materials + Direct Labour + Hosting + Customer Success
COGS per Unit = COGS / (#Customers)
Gross Profit Margin = MRR – COGS
In this scenario, LTV is $367 as shown below

Now that we can calculate LTV, it’s time to look at the denominator – CAC.
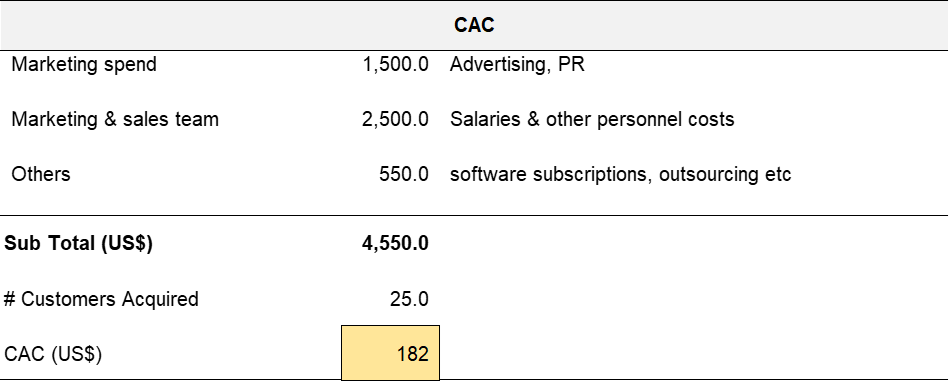
CAC: Refers to the total cost a business incurs to acquire a new customer, taking into account all marketing and sales expenses. It’s calculated by dividing all costs spent on acquiring more customers (marketing and sales expenses) by the number of customers acquired in the period the money was spent. It provides insight into the value of a customer in relation to the cost of attracting that customer.
LTV/CAC: With all the variables in place, it’s time to calculate LTV/CAC. This metric provides an insight into the long-term value of a customer in relation to the cost of acquiring them. Essentially, it answers the critical question: “what is the return on investment for every dollar spent to acquire a customer?”

Here, this startup has a ratio of 1.3x, assuming a early-stage (pre-seed for instance) startup, this could be a decent start. An LTV/CAC ratio of 3:1 is often cited as a general benchmark (for SaaS businesses), but it’s worth perusing large, public traded startups’ financial reporting within your industry for more precise benchmarks. Also, it is expected achieving a good ratio is a journey and it’s rare for very early stage startups to start with a good enough ratio. All you need to do is to demonstrate that you can achieve a good benchmark in the medium to long term.
—————————–
How to Calculate CAC Payback Period
A related metric for evaluating a startup’s business model is the CAC Payback period. This is the time it takes to recoup investment in acquiring a new customer, through the gross profit generated from that customer. A shorter CAC Payback Period is favourable, indicating a quicker return on investment and efficient use of capital invested in customer acquisition.

In this scenario, each customer pays back CAC investment in 5 months. CAC payback exceeding 12 months is usually a red flag but it also depends on the industry and business model.
Customer Profitability Analysis
LTV/ CAC and CAC Payback Period have their uses and investors rely on these two to evaluate and rank startups. However, they have their drawbacks which include subjectivity of all the assumptions required to estimate these metrics. Customer profitability makes up for these drawbacks as it is relatively simple and straightforward. It is however much more conservative and will be unflattering for many early-stage startups. However, all startups must trend towards being profitable from a P&L perspective as they scale so it’s worth understanding and calculating this metric even in the early days.
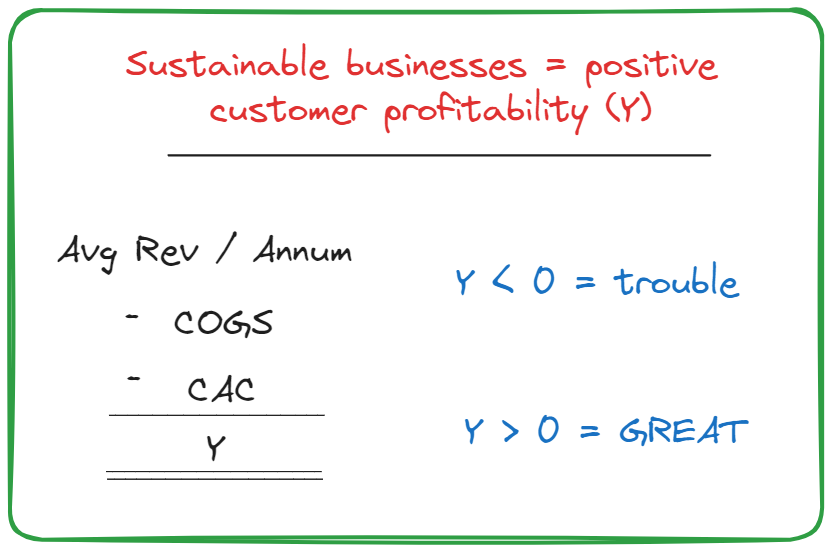
Very simply on an annual basis, you must get more OR make more money from each unit (customer) than it takes to produce the goods (or services), acquire the customer, and serve them.
Conclusion
Understanding your unit economics is important but interpreting them to tell a compelling story is arguably more important. By mastering unit economics and crafting a narrative, founders are better equipped to gain the trust of investors and more importantly set their startup on the path to success.
If you forget everything else in this post, here’s one thing to remember: to be a venture scale startup, you must be able to grow 10x in first year or so of revenue and then 3x thereafter. But… here’s where unit economics comes into play, the more you scale, the less losses you record until you turn profitable. If your losses increase as you scale, then there’s a problem for you and your investors!
Caena’s financial modelling tools helps founders build projections and understand unit economics without any prior finance knowledge or need to know to handle complex spreadsheets. Get started for free and upgrade your account when you need it.