Founder Financial Literacy: Enhancing Decision-Making and Improving Chances of Successful Fundraise
As a founder and / or CEO of a startup, you don’t have to be a Chartered Financial Analyst (CFA) or chartered accountant. But you need to be sufficiently financially literate to ensure your startup or small business stands a better chance of succeeding. Cashflow issues are by far the greatest cause of startup failure, contributing to the collapse of 82% of small businesses according to a research of US businesses by SCORE.
One of the basic entrepreneurial finance skills is financial statement analysis. In the context of a small business, a founder must be able to explain their own financial reports and also be able to understand how discrete transactions impact the different financial statements. What makes analysing financial statements complex is the web of interconnectedness between the three statements.
The Three Financial Statements
For founders of companies that have been operational for a few years, your accountant would most likely prepare annual reports as required by law in the UK and some other countries. If you take a look at those reports, you will see three main sections near the front:
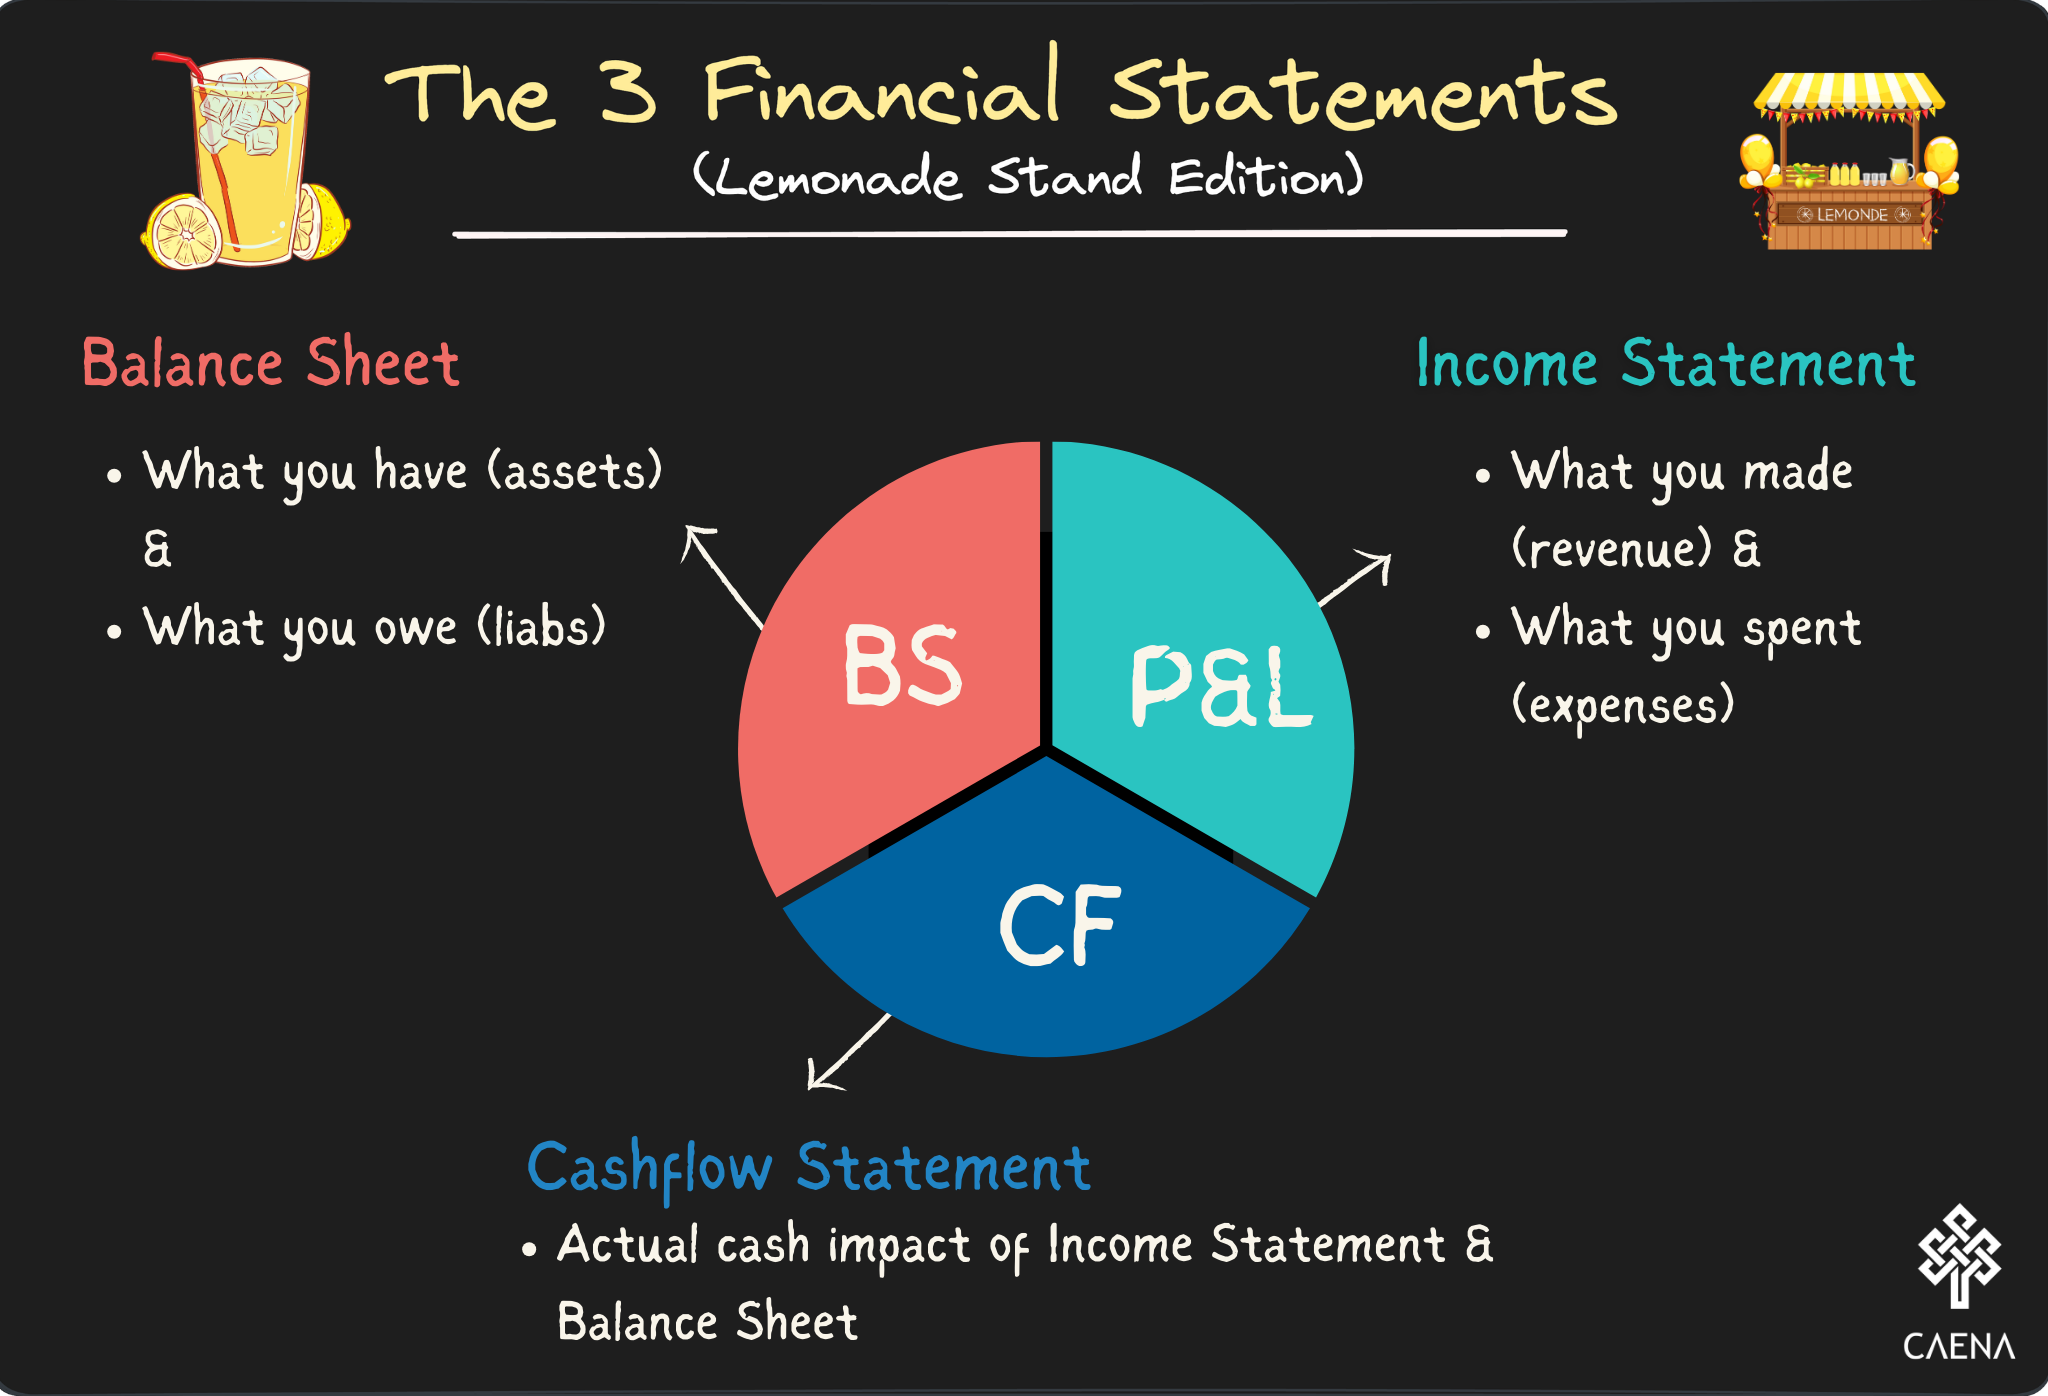
- The income statement (also known as the profit and loss statement)
- The balance sheet and
- The cashflow statement.
These three statements are relied on by investors, bankers, regulators and others to glean information and form a view on the company’s financial health and prospects.
The Income Statement
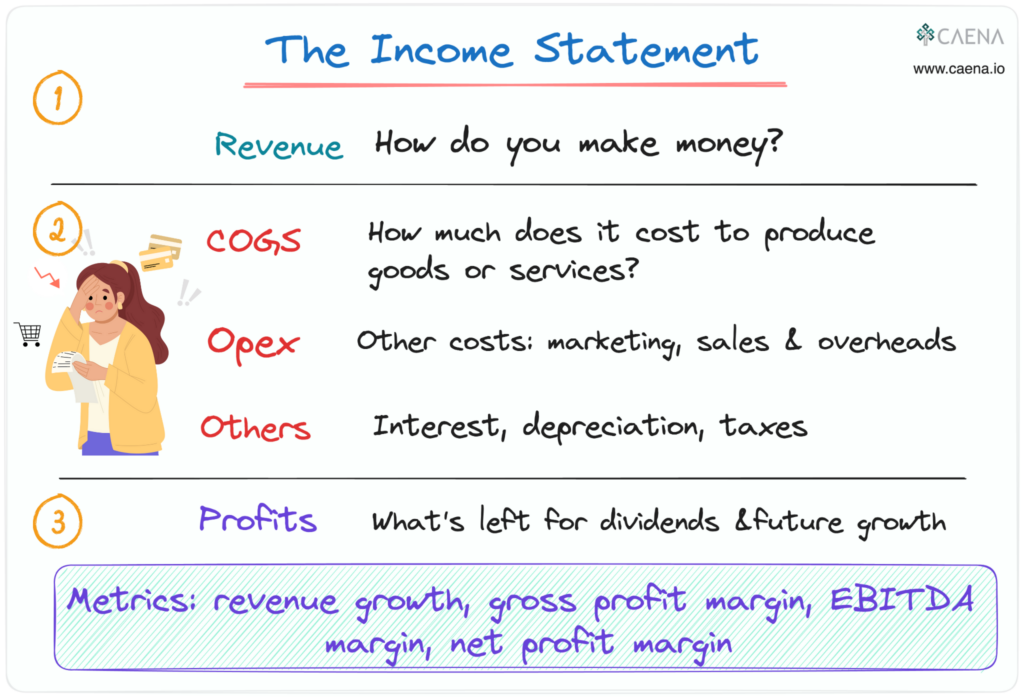
The simplest way to think of the income statement is as a report card on the overall profitability of your business in a certain period of time – monthly, quarterly or annually. The income statement helps you, internal and external stakeholders understand how much revenue you recognise and what your total expenses are within the period. There are just two broad inputs into the income statement which answer a set of questions each:
- Revenue: How much money do you make from customers? Are there different revenue streams? How fast is your revenue growing?
- Expenses: What are the essential expenses you incur to provide the goods or services you render, i.e. cost of goods sold (COGS) or direct costs? What are the sales and marketing costs required to get your goods / services to customers? What are other administrative and overhead costs? Combined, these last two are referred to as sales, general and administrative costs (SG&A). After these, there are other costs such as interest, depreciation and taxes.
Beyond the two inputs, there are two sets of inferences that complete the income statement:
- Profits: in the profit & loss statement, there are several measures of profitability as you walk down from revenue. Quite simply, profits are what’s left after deducting a class of expenses from revenue or a previous sub-profit category. For instance:
Gross Profit = Revenue – COGS
EBITDA = Gross Profit – SG&A
Profit Before Tax (PBT) = EBITDA – (Other Costs)
Profit After Tax = PBT – Tax
- Margins: The profits as described above are in absolute terms which is useful but has limitations. For instance, given two startups operating in same industry and at roughly similar stages which have the following Gross Profits:
1️⃣ $120,000
2️⃣ $90,000
- Which is the better run company?
- Is a gross profit of $120,000 better than $90,000? Yes? No?
- When I ran this poll on LinkedIn, majority of respondents (65%) picked Startup A as the better run company

-
- If you picked either option, you’re wrong, Sorry! There isn’t enough information to decide because those numbers are meaningless in absolute terms.
- That’s where margins come in, let’s assume startup A has revenues of $240,000 while B has revenues of $120,000 then they have Gross Profit Margins of 50% and 75% respectively. B with less absolute revenue and gross profits is the better run company or has a better business model.
- In short, margins allow for easy comparison to make sense of absolute numbers and enable more informed decision making. The GP margin can also be compared to industry benchmarks to get a better sense of how a specific company is performing.
- The margins in the income statement are typically expressed as a function of revenue. That is, a measure of how efficient a company is in converting every $ of revenue into the respective sub-profits:
Gross Profit Margin = Gross Profit / Revenue
EBITDA Margin = EBITDA / Revenue
Net Profit Margin = Net Profit / Revenue
Profit After Tax = PBT – Tax
The Balance Sheet and The Cashflow Statement
As the income statement comprises two ‘simple’ elements of revenues and costs, the balance sheet can similarly be simplified into two inputs: your assets (what you own) and your liabilities (what you owe). There is one difference between the P&L and the BS though: whereas the P&L covers activities between two dates, the balance sheet is a snapshot on a certain date. That is, for a company reporting full year 2023 numbers, the P&L and cashflow will cover the period between Jan 1 and Dec 31, 2023 while the BS will be as at Dec 31.
The cashflow statement on the other hand deals with actual cash implications of the transactions in balance sheet and income statement. This is important because it is possible to be profitable yet the business has run out of cash
Finance Glossary – Starter Pack
- Income Statement: A report showing how much money comes in (revenue) and goes out (expenses) over a period, ending with profit or loss.
- Balance Sheet: A snapshot of what the startup owns (assets) and owes (liabilities), with the remainder as the owner’s stake (equity).
- Cash Flow Statement: A record of the actual cash moving in and out, highlighting how the business pays its bills and invests.
- Gross Revenue: The total money made from sales before subtracting any costs.
- Net Income: What’s left as profit after all expenses are taken out of revenue.
- EBITDA: Earnings before interest, taxes, depreciation, and amortization; it shows how much money the business makes from operations.
- Burn Rate: The speed at which a startup spends its available cash.
- Runway: The number of months a startup can continue operating before it runs out of cash.
- Cap Table: A list detailing the ownership stakes and shares held by founders, investors, and employees.
- Valuation: An estimate of the startup’s overall worth.
- Pre-money Valuation: The value of the startup before receiving new investment.
- Post-money Valuation: The value of the startup immediately after new investment has been added.
- Operating Expenses: The ongoing costs required to run the business, like rent, salaries, and utilities.
- Cost of Goods Sold (COGS): The direct costs of producing or delivering a product or service.
- Break-even Point: The moment when total revenue equals total expenses, meaning the business isn’t losing money but isn’t making a profit yet.
- Financial Modeling: Using spreadsheets to project future revenues, expenses, and cash flows based on different assumptions.
- Discounted Cash Flow (DCF): A method to estimate the value of the startup by calculating the present value of its future cash flows.
- Sensitivity Analysis: Testing how changes in key numbers (like costs or sales) can affect the overall outcome of the financial model.
- Scenario Analysis: Comparing different “what if” situations (like best-case or worst-case) to see how outcomes change.
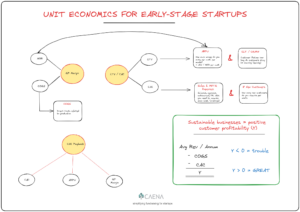
- Unit Economics: Understanding the profit or loss generated from each individual sale or customer.
- Customer Acquisition Cost (CAC): The average cost to gain one new customer.
- Lifetime Value (LTV): The total profit expected from a customer over the entire time they do business with the startup.
- Gross Margin: The percentage of revenue left after subtracting COGS, showing product profitability.
- Operating Margin: The percentage of revenue remaining after covering operating expenses, reflecting core business efficiency.
- Debt vs. Equity Financing: Different ways to raise money—debt involves borrowing funds, while equity means selling a share of the company.
👍